Vibe Analysis
Despite its unserious name, vibe coding shows promise for elements of serious scholarly work
by Dan Cohen
[This is the third piece in a miniseries on finding the right line between human thought and AI assistance, focusing on the stages of scholarly work from initial ideas through the research process to publication, although I believe much of this discussion is applicable to intellectual work beyond the academy. The miniseries began with this introduction and was followed by an essay on the origins of new ideas. In this issue, a look at how we begin to analyze evidence and data.]
So you have that great idea for a research project, and you’ve found or developed sources, perhaps with AI-assisted search and discovery within collections. Now comes the analysis, how we extract meaning and assemble a thesis out of these research materials. Where should scholars draw the line on using, or avoiding, AI to do this analysis?
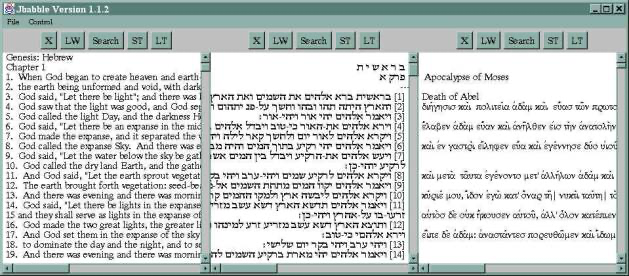
First, we need to unpack what “analysis” really means and how we do it. In 2000, John Unsworth proposed a helpful agenda for the nascent field of digital humanities that focused on using the power and flexibility of digital media to improve “scholarly primitives,” or the fundamental ways that scholars view, inspect, and interpret their sources. Unsworth was not out to replace the entire scholarly process, but to enhance its early-stage, basic components, such as annotation, comparison, and sampling. For instance, in Biblical scholarship it is helpful to compare parallel texts in English, Hebrew, and Greek; indeed, there are many scholarly editions in this format, and they are often used for more rigorous exegesis than unilingual volumes.
What if we could produce such aids to serious scholarship using computers? Unsworth’s innovative group at the University of Virginia, the Institute for Advanced Technology in the Humanities (IATH), created software that could provide, on the fly, three-column views such as this:
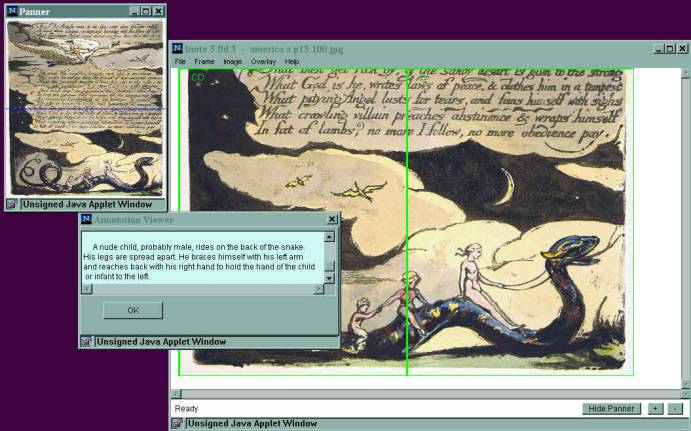
Or, if a scholar wanted to study the visual arts rather than texts more closely, we could create software to zoom in on details, highlight them, and craft descriptions and analytical notes:
The technology to do this work in 2000 was complex, and since it took considerable programming time, rather expensive. When the book I wrote with Roy Rosenzweig, Digital History, came out twenty years ago, one review praised many of the new approaches, but worried, rightly, about the cost of building and maintaining anything involving computers and programmers.
* * *
Flash forward two decades: The “building” phase of scholarly software has, within the last few months, become greatly accelerated and inexpensive, along with all other forms of software development. I hesitate to use the tech bro-logism “vibe coding” here, but whatever we call it, there’s no doubt that it is orders of magnitude easier to generate the kind of software that it took Unsworth and IATH, or Roy and myself and our colleagues at the Center for History and New Media, months or even years to build, at a significant cost. Moreover, “maintaining” such software over time matters less for a scholar doing their research project than it does for the production-grade software IATH (Babble, Inote) and CHNM (Zotero, Omeka) created for general-purpose use. For individual academics, vibe coding can provide a quick and easy tool to examine and analyze raw material under their consideration. The scholarly primitives have evolved.
Some scholars are already working with AI in this way — not creating full articles from a single prompt, but producing discrete analytical units that present documents, images, and data in ways that help their research process. This is clearly a beneficial use of AI: assisting human interpretation rather than replacing it, using digital media to frame scholarly resources so that the scholar can reach new conclusions.
Take this example from Sarah Bull, like me a Victorianist, who studies the history of the publishing industry in the UK. She recently wrote a monograph on the lively intersection of the medical profession, publishers, and pornography in the nineteenth century, Selling Sexual Knowledge: Medical Publishing and Obscenity in Victorian Britain. In her research, Bull found or assembled useful data sets, like the London addresses of publishers of works that were deemed “obscene.” (In a fascinating parallel to today’s dopamine-fueled social media, many of these salacious books were mashups of titillating bits drawn from other sources.) As a companion to the book, she used Claude Code to produce an interactive digital map that helps to situate herself, and her readers, within that demimonde:
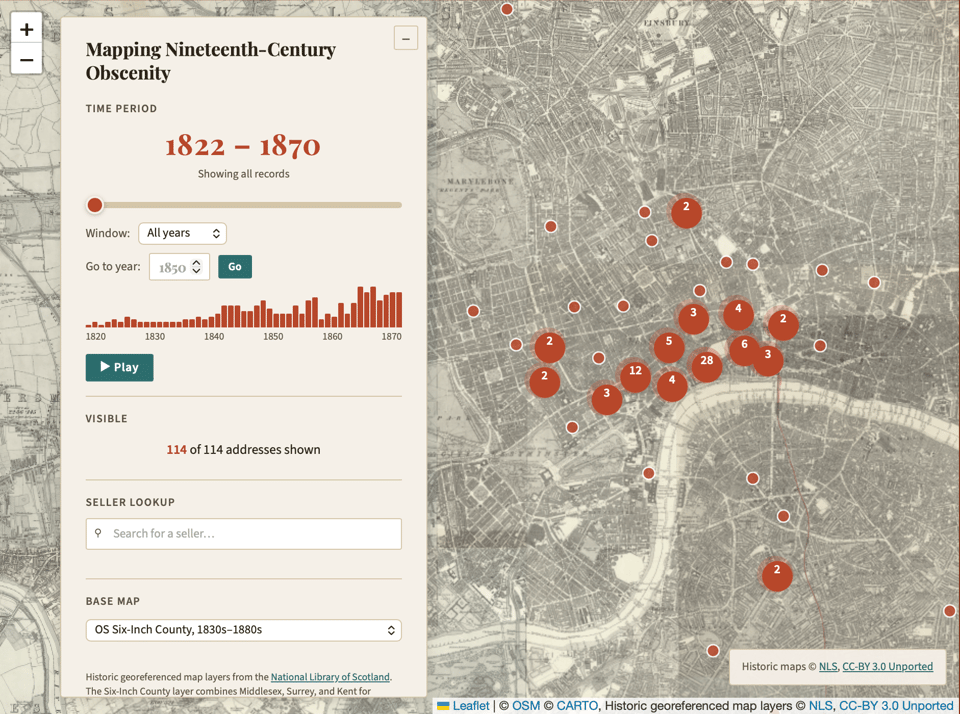
(There’s a reason that a small street near the Strand got the nickname the “Backside of St. Clements.”) In the spirit of scholarly citation and reproducibility, Bull provides the code and references for the map on GitHub, allowing others to clone her analytical tool for other data sets.
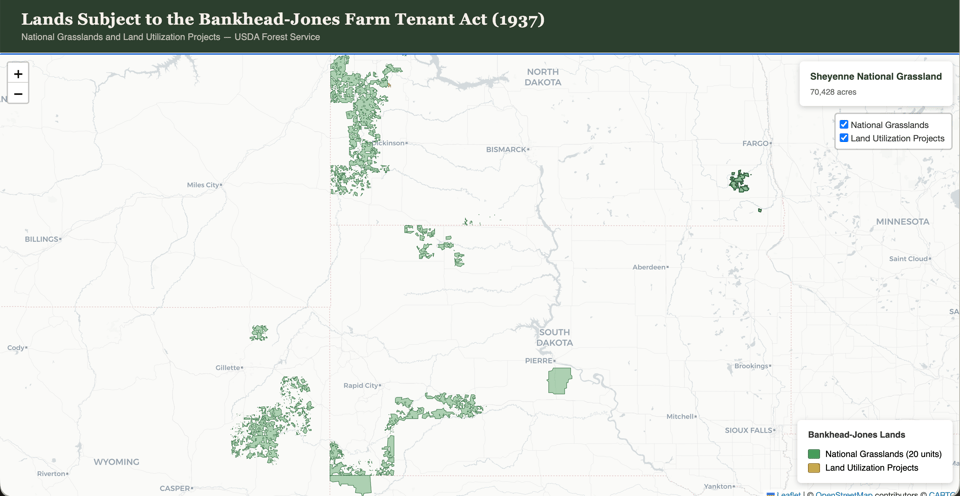
Similarly, historian Jason Heppler recently used AI to help him map land use in the United States, a process that would have taken countless hours without this automation.
I am in the throes of a research project for a book on the politics around land, agriculture, environmentalism, and land management on the Great Plains. It occurred to me recently that I need to stretch my timeline backwards a bit to the Bankhead-Jones Act of 1937…I wanted to see these lands, in part because one thing that’s complicated about writing this regional history I’m working on is the quilted patchwork of public and private land ownership and management that happens on the grasslands. So I asked Claude: without any input from me, find the data and make this map. It took about fifteen minutes.
Heppler’s coda to his post on “vibing digital history” strikes me as exactly right:
The point here is that if these tools…create things in a fraction of the time it once took, then these tools are phenomenally empowering,…an investment in one’s intellectual work. [Having AI do the] rote or routine work can free up your time to focus on the history rather than the technology.
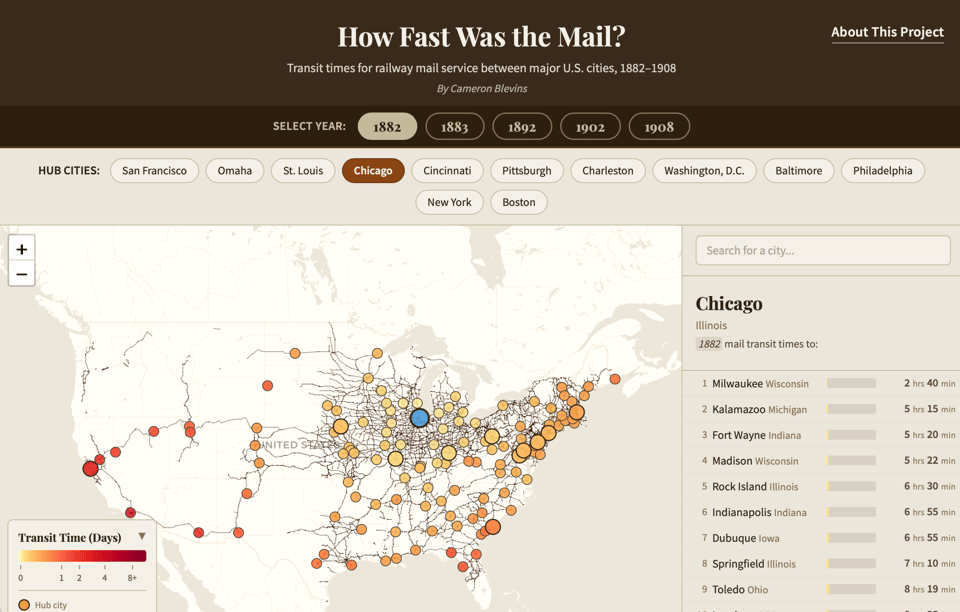
Yes, let the machine take care of the scut work so you can spend your human time thinking about the crucial interpretive aspects of your research — a sensible and effective division of labor. And there can be a great deal of scut work in research, historical and otherwise. Historian Cameron Blevins recently produced an interactive digital map, similar to those by Bull and Heppler, but also had the AI do another, even more tedious task first: extracting tabular data from low-resolution digitized documents. The result of this one-two punch is a neat visualization of how long it took for a piece of mail to make its way between two destinations in the U.S. in the late nineteenth and early twentieth centuries.
These rapidly produced maps using AI can be a new tool in the kit of researchers, aiding in both unstructured exploration or, more narrowly, to support a thesis.
* * *
Should we worry about AI hallucinations invisibly corrupting these digital constructions, and thus tainting the theses of these scholars? Because the researchers are not using these tools to formulate conclusions, and because their models maintain the original data so they, and anyone else, can spot-check them, this seems like much less of a concern than using AI further along in the scholarly process. Moreover, they are using these tools as part of a broader process of scholarship that still involves traditional methods such as the close reading of texts. They understand the need to construct an interconnected web of evidence for their articles and books, just as they did before. In this wider context, vibe coding and diligent analysis can coexist.
Although I have focused here on interactive digital maps, most of the other scholarly primitives John Unsworth outlined a quarter century ago can also be swiftly replicated using AI. For instance, it is now possible for scholars to create multicolumn views of parallel texts, or an app that performs an initial pass of handwriting recognition on manuscripts, letters, or diaries, and then provides a text editor for the researcher to correct any errors (with the original document in an adjacent window), or a visual environment for an assembled set of artworks as an aid in side-by-side comparisons or as a place to highlight and annotate details. For scientists, the scholarly primitives are different but equally tractable, enabling highly customized databases, graphical interfaces for exploring data, and the automation of digital lab notebooks.
In my own tests, this isn’t a completely seamless process yet. It helps to know your way around the command line and file system, and understand what Python, SQLite, HTML, and other programming, web, and database languages and packages are, and how to install, update, and tweak them. In addition, on the data side, scholarly vibe coding often relies on sources being openly available and thus open to AI applications, an assumption that may be challenged by a brewing backlash against AI among the holders of collections.
And then there is the slippery slope: If we are going to go this far with AI in scholarship, why not go farther or even all the way? Why not have AI do the entire analytical process and spit out the result, perhaps as a nicely formatted paper? Knowing the audience for this newsletter, this is an uncomfortable question. But it’s one that we should at least ask and take some time to think through. It will be the topic of the next piece in this miniseries.